4.2.2. Extended
This example implies more subsystems and virtualization using Incus. It is meant to be a more extended base for productive settings and contains various components of other free software projects for system administration. While this base is automated and tested there will always be specific needs for your inidividual setup to add or change. The system to be constructed will look like this:
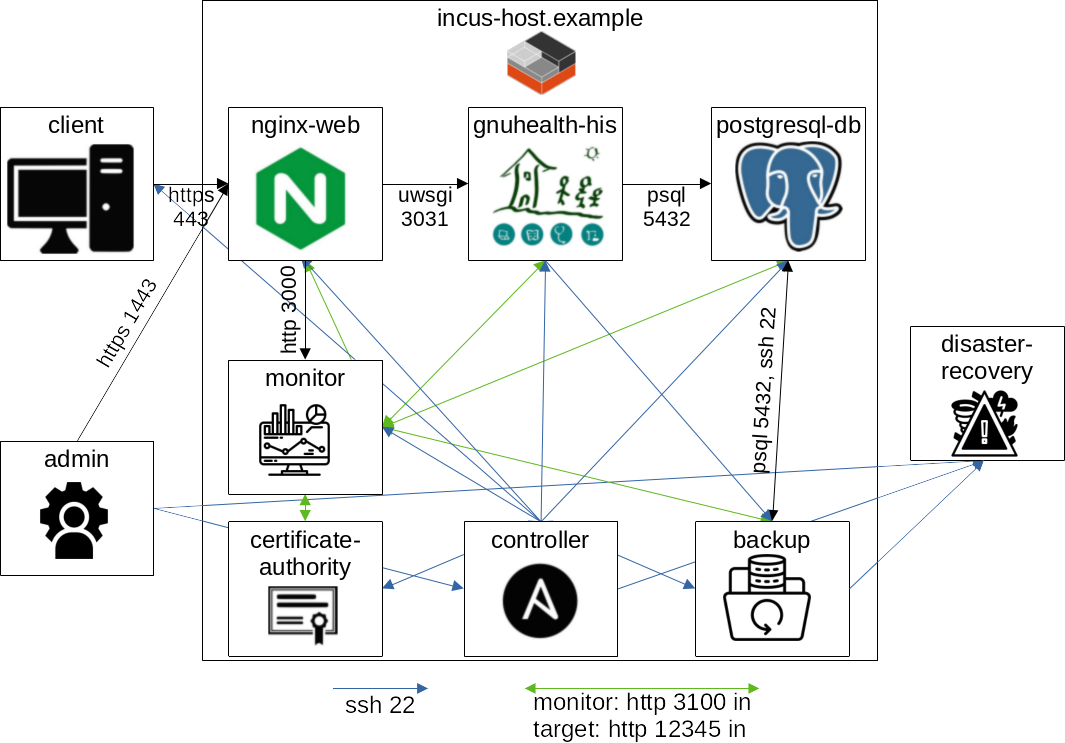
Overview of the system to be created. The directed arrows represent connection requests that still expect responses. All ports are only TCP. Arrows entering the Incus host imply an Incus proxy to forward the request. Icons that are not specific software logos taken from flaticon.com.
In this example we are using the following host names associated with the following IP addresses:
nginx-web.incus: 10.6.242.111
gnuhealth-his.incus: 10.6.242.112
postgresql-db.incus: 10.6.242.113
certificate-authority.incus: 10.6.242.114
backup.incus: 10.6.242.115
monitor.incus: 10.6.242.116
controller.incus: 10.6.242.117
disaster-recovery.incus: 10.6.242.121
client.incus: 10.6.242.131
4.2.2.1. Prepare Incus host
First thing to do is to set up the Incus host. This might also be a cluster but how to set up a cluster is out of this scope.
For that install Incus on a Debian host, e.g. using Zabbly APT instructions for stable repository here.
Next apply production settings for Incus.
Add your user to the incus-admin group:
$ sudo usermod -aG incus-admin $USER
$ newgrp incus-admin
Initialize Incus and keep default values except setting IPv6 to none (otherwise change IP addresses throughout the whole example and corresponding inventory):
$ incus admin init
Now create a network and a project that uses the network and is activated:
$ incus network create incusbrgh
$ incus network set incusbrgh ipv4.address 10.6.242.1/24
$ incus network set incusbrgh ipv6.address none
$ incus project create gnuhealth
$ incus project switch gnuhealth
$ incus profile edit default
The network device eth0 should be configured such that it uses the newly created network. Meanwhile we also define a root disk device:
devices:
  eth0:
    name: eth0
    network: incusbrgh
    type: nic
  root:
    path: /
    pool: default
    type: disk
Later on we will set up a monitoring server to grab metrics and logs from the Incus host. Prepare this by the following configuration:
$ incus config edit
config:
  core.metrics_address: :8444
  loki.api.url: http://localhost:3100
  loki.instance: incus
Now generate and trust a certificate for accessing the metrics (see Incus docs for further information):
$ openssl req -x509 -newkey ec -pkeyopt ec_paramgen_curve:secp384r1 -sha384 -keyout metrics.key -nodes -out metrics.crt -days 3650 -subj "/CN=metrics.local"
$ incus config trust add-certificate metrics.crt --type=metrics
Finally open the Nftables config:
$ sudo nano /etc/nftables.conf
Modify the chain input block like this and leave the rest untouched:
table inet filter {
      chain input {
               # Default policy: drop
               type filter hook input priority filter; policy drop;

               # Allow local network interface, ping and established connections
               iif "lo" accept
               meta l4proto { icmp, ipv6-icmp } accept
               ct state established,related accept

               # Allow DNS & DHCP
               ip6 daddr fe80::/64 udp dport dhcpv6-client accept
               iifname { incusbrgh, incusbr0 } tcp dport 53 accept
               iifname { incusbrgh, incusbr0 } udp dport 53 accept
               iifname { incusbrgh, incusbr0 } udp dport 67 accept

               # Open ports for SSH, Nginx & metrics
               tcp dport 22 accept
               tcp dport 443 accept
               tcp dport 1443 accept
               tcp dport 8444 ip saddr 10.6.242.116/32 accept
      }
Create a shell script to restart Nftables properly:
cat > restart_nftables.sh <<'EOF'
$#!/bin/bash

set -x

sudo systemctl restart nftables.service
sudo systemctl restart incus.service
! incus info monitor || incus restart monitor
! incus info controller || incus restart controller
! incus info nginx-web || incus restart nginx-web
sleep 5
sudo nft list ruleset
EOF
And run it:
$ bash restart_nftables.sh
This is necessary because Nftables rules are coming both from our own config file and Incus. Besides proxy devices for port forwarding will create their rules on startup. To sum up it should avoid confusion through missing or non-functioning firewall rules.
4.2.2.2. Prepare Incus instances
Warning
For start this example creates the client and disaster-recovery system inside the Incus host. The idea is to first change the scenario to your needs in one virtual environment and then separate those systems when you go productive. At that point you would remove those two systems from commands below continously and handle them distinctly.
Having the Incus host in place we can now generate all the instances:
$ incus launch images:debian/bookworm/cloud nginx-web -d eth0,ipv4.address=10.6.242.111
$ incus launch images:debian/bookworm/cloud gnuhealth-his -d eth0,ipv4.address=10.6.242.112
$ incus launch images:debian/bookworm/cloud postgresql-db -d eth0,ipv4.address=10.6.242.113
$ incus launch images:debian/bookworm/cloud certificate-authority -d eth0,ipv4.address=10.6.242.114
$ incus launch images:debian/bookworm/cloud backup -d eth0,ipv4.address=10.6.242.115
$ incus launch images:debian/bookworm/cloud monitor -d eth0,ipv4.address=10.6.242.116
$ incus launch images:debian/bookworm/cloud controller -d eth0,ipv4.address=10.6.242.117
$ incus launch images:debian/bookworm/cloud disaster-recovery -d eth0,ipv4.address=10.6.242.121
$ incus launch images:debian/bookworm/cloud client -d eth0,ipv4.address=10.6.242.131 --vm
Cloud images are used because cloud-init provides a user already and works smoother e.g. if setting a disk size such that the size is already allocated when starting the instance. Running Ansible will require SSH & Python on the instances. Besides we need a password set for SSH (to set it key based later on) and disable passwordless sudo (to complicate privilege escalation):
$ read -s -p "Enter password:" NEW_USER_PW
$ for instance in "nginx-web" "gnuhealth-his" "postgresql-db" "certificate-authority" "backup" "monitor" "controller" "disaster-recovery" "client"; do incus exec $instance -- bash -c "apt update && apt install -y openssh-server python3 && (echo 'debian:${NEW_USER_PW}' | chpasswd) && rm /etc/sudoers.d/90-cloud-init-users"; done
Testing the GNU Health client would require a GUI on the client:
$ incus exec client -- bash -c "apt update && apt install -y xorg mate-desktop-environment"
The monitoring system will need the certificates that we just created for authentication. Besides we pass the Incus hostname to the controller for later configuration:
$ incus file push metrics.crt monitor/home/debian/
$ incus file push metrics.key monitor/home/debian/
$ incus file push /var/lib/incus/server.crt monitor/home/debian/
$ echo $(hostname) > incus_hostname
$ incus file push incus_hostname controller/home/debian/
Finally create snapshots to avoid restarting from scratch if something goes wrong:
$ for instance in "nginx-web" "gnuhealth-his" "postgresql-db" "certificate-authority" "backup" "monitor" "controller" "disaster-recovery" "client"; do incus snapshot create $instance init; done
4.2.2.3. Prepare controller
Now log in to the controller and switch the user:
# incus shell controller
$ su debian
Afterwards set up the requirements exactly as described in the previous example.
Setting up SSH will be similar but not the same as in the previous example:
$ tar -cf ../gnuhealth-ansible_$(cat VERSION)_$(git rev-parse --abbrev-ref HEAD)_fresh_$(date +"%Y-%m-%d").tar .
$ ansible-playbook playbooks/ssh.yml -i inventories/dev -e inventory_hostname='controller.incus' -c local -e ssh_key_create=1 -e ssh_key_user=$USER -e ssh_key_fetch=1 -K
$ cp -r inventories/test/gnuhealth_prod_ext/* inventories/prod/
$ for instance in "nginx-web" "gnuhealth-his" "postgresql-db" "certificate-authority" "backup" "monitor" "disaster-recovery" "client"; do ssh-keyscan -H ${instance}.incus | sudo tee -a /etc/ssh/ssh_known_hosts; done
$ ansible -i inventories/prod ssh -m ping -k
$ ansible-playbook playbooks/ssh.yml -i inventories/prod -k -K
$ ansible -i inventories/prod ssh -m ping
$ cp inventories/dev/group_vars/ssh/vars.yml inventories/prod/group_vars/ssh/vars.yml
After those steps the controller has a new SSH key pair and trusted the other instances host keys. The other instances are configured to trust the controllers SSH key and disable password based authentication. In between we test the SSH connection with Ansibles ping module. Finally we overwrite ssh/vars.yml to avoid having those steps recalled later on from other roles. In the beginning we saved an archive of the unmodified version of the repository - later a modified one as well.
Now set your incus hostname for the Prometheus connection on the monitoring system:
$ sed -i "s?^.*plg_p_incus_servername:.*?plg_p_incus_servername:\ \"`cat /home/debian/incus_hostname`\"?" inventories/prod/group_vars/gnuhealth/vars.yml
Besides its actual FQDN hostname has to be set for nginx_rproxy_domain in inventories/prod/group_vars/gnuhealth/vars.yml.
It will be used for the certificate and has to match the way the client will access it later on.
In case you are still testing all on one Incus host you can leave its default value but have to apply a tweak to the client such that it can use it for connecting (on incus-host, not controller):
$ incus exec client -- bash -c "echo '10.6.242.1 incus-host.example' >> /etc/hosts"
The monitoring system is meant to sent email alerts using SMTP.
Get a dummy email address only for this prupose and enter its smtp connection and the email address itself for plg_g_smtp_host and plg_g_smtp_user in inventories/prod/group_vars/gnuhealth/vars.yml.
Besides set its password for vault_plg_g_stmp_pw in inventories/prod/group_vars/gnuhealth/vault.yml and roll and store passwords for all other variables in that file - those will be set in the playbook execution.
Finally encrypt the passwords:
$ ansible-vault encrypt inventories/prod/group_vars/gnuhealth/vault.yml
Having the configuration in place let’s make more snapshots before executing playbooks (on incus-host, not controller):
$ for instance in "nginx-web" "gnuhealth-his" "postgresql-db" "certificate-authority" "backup" "monitor" "controller" "disaster-recovery" "client"; do incus snapshot create $instance b4exe; done
4.2.2.4. Run playbooks
Now run the playbooks to set up the desired system:
$ ansible-playbook playbooks/gnuhealth.yml -i inventories/prod -K --ask-vault-pass
$ ansible-playbook playbooks/desktop.yml -i inventories/prod -K --ask-vault-pass
If everything run successfully create another archive of your modified state of the git repository:
$ tar -cf ../gnuhealth-ansible_$(cat VERSION)_$(git rev-parse --abbrev-ref HEAD)_configured_$(date +"%Y-%m-%d").tar .
The Incus host has to forward requests to the internal machines for:
Nginx on port 443 for the GNU Health server
Nginx on port 1443 for Grafana dashboard
Controller on port 22 if direct SSH access is desired
Besides it’s sending Loki requests to itself and just forwards them into the monitoring machines port 3100.
Note that this port was not opened in Nftables for purpose and should NOT be exposed to the public!
Those port forwards can be realized with proxies (on incus-host, not controller):
$ incus config device add nginx-web port443 proxy listen=tcp:0.0.0.0:443 connect=tcp:127.0.0.1:443
$ incus config device add nginx-web port1443 proxy listen=tcp:0.0.0.0:1443 connect=tcp:127.0.0.1:1443
$ incus config device add controller port22 proxy listen=tcp:0.0.0.0:2222 connect=tcp:127.0.0.1:22
$ incus config device add monitor port3100 proxy listen=tcp:0.0.0.0:3100 connect=tcp:127.0.0.1:3100
Finally make snapshots again (still incus-host):
$ for instance in "nginx-web" "gnuhealth-his" "postgresql-db" "certificate-authority" "backup" "monitor" "controller" "disaster-recovery" "client"; do incus snapshot create $instance afexe; done
4.2.2.5. Check the new system
Verify you can connect using the GNU Health client and do your individual customizing.
You might counter check firewall cases as in the previous example and should furthermore think of specific needs and tests.
If you are stil testing the scenario on one Incus host but can not run a GUI on your client you can also test connectivity non-interactively without a GUI:
$ incus shell client
# source /opt/gnuhealth/his-client/venv/bin/activate
# pip install proteus
# cat > test.py <<'EOF'
import sys
from proteus import config
from getpass import getpass
password = getpass()
print('Connecting to the server using HTTPS...')
conf = config.set_xmlrpc("https://admin:{pw}@{host}/health/".format(pw = password, host = sys.argv[1]))
print('Success')
EOF
# python3 test.py incus-host.example
The prompt asks for the password that you set as vault_tryton_pw in inventories/prod/group_vars/gnuhealth/vault.yml.
4.2.2.6. Explore the monitoring system
The monitor instance contains a Prometheus-Loki-Grafana stack.
Its components roughly have the following objectives:
Prometheus: Aggregate metrics (pull)
Loki: Aggregate logs (push)
Grafana: Visualize collected metrics & logs
The counterpart is Grafana Alloy as agent on the instances to monitor. Besides Incus provides easy integration inherently.
You can access Grafana from a browser by navigating to https://incus-host.example:1443.
There are public dashboards that you can import for visualization:
Follow this steps to set up a dashboard for the Incus host - also showing metrics for the instances. Default values http://localhost:9090 for Prometheus and http://localhost:3100/ for Loki can be kept as they are on the same system as Grafana.
Import a Linux Host Metrics dashboard having the ID
10180to see metrics for single instances independent from Incus
If you want email notifications you need a contact point: Go to Alerting -> Contact Point -> Create. Then set name & address, hit Test and save.
Alert rules can directly be created from values in dashboards.
For example through Dashboards -> Linux Host Metrics -> Host postgresql-db -> Disk Free (Total) -> Menu:More:New alert rule:
Threshold : Something above the value you saw to test alert
Folder: test
Evaluation group: 1min-group
Contact Point: The one you just created
Summary: Disk space threshold exceeded
Save rule and exit
Get an email after a minute, change threshold to desired threshold for alert
4.2.2.7. Disaster Recovery
4.2.2.7.1. Prepare
The PostgreSQL database cluster on
postgresql-hisalready produced data onbackupand the controller already has Ansible related data. However we need to generate data onbackupcoming fromgnuhealth-his. To do so you can ideally generate PDFs inside the GNU Health client or just create a test file (from the Incus host):
$ incus exec gnuhealth-his -- bash -c "echo 'test' > /opt/gnuhealth/his/data/attach/test"
Set restic passwords in
inventories/prod/group_vars/disaster_recovery.yml, store them e.g. in a password manager outside the Incus host and encrypt them afterwards:
$ ansible-vault encrypt inventories/prod/group_vars/disaster_recovery.yml
Generate a SSH key pair on your
adminsystem or anywhere outside the Incus host. Set the public SSH key as string ininventories/prod/host_vars/disaster-recovery.ymlfordr_server_recovery_key. Those key pair and passwords are critical to actually be able to recover fromdisaster-recovery. The password protecting the SSH private key and a potential sudo password needed after connecting to it might be critical as well.Run the playbook disaster-recovery:
$ ansible-playbook playbooks/disaster-recovery.yml -i inventories/prod/ -e dr_ssh=1 -e dr_setup=1 -K --ask-vault-pass
Generate snapshots again from your Incus host:
$ for instance in "nginx-web" "gnuhealth-his" "postgresql-db" "certificate-authority" "backup" "monitor" "controller" "disaster-recovery" "client"; do incus snapshot create $instance dr; done
4.2.2.7.2. Recover
The recovery process should only need your disaster-recovery system, the SSH key pair, the password of its secret key & restic passwords from the previous step Prepare and probably a sudo password.
It should be tested in the beginning and continuously for your specific setup.
In order to test recovery you could use another Incus host, another project and network, move old instances or just delete old instances. It would not be sufficient to restore from snapshots because in a real scenario we would have new host keys and SSH client keys. Here we will just delete the instances. If moving them on the same host to keep them you have to change their IP addresses, restart them and then move (rename) them because otherwise you can not overtake their IP addresses.
$ for instance in "nginx-web" "gnuhealth-his" "postgresql-db" "certificate-authority" "backup" "monitor" "controller" "client"; do incus delete -f $instance; done
Next repeat all steps from Prepare Incus instances and Prepare controller but remove disaster-recovery from for loops if still testing on one Incus host.
Regarding Setting up SSH while preparing the controller there is one addition:
After running the SSH playbook the first time you have your new public SSH key in fetch/controller.incus.pub (ansible-playbook playbooks/ssh.yml -i inventories/dev -e inventory_hostname=’controller.incus’ -c local -e ssh_key_create=1 -e ssh_key_user=$USER -e ssh_key_fetch=1 -K).
Use your admin system to connect to disaster-recovery and put this public key in /home/debian/.ssh/authorized_keys (as string).
This has to be done before testing SSH connectiviy (ansible -i inventories/prod ssh -m ping -k).
Afterwards do not run gnuhealth.yml but prepare disaster-recovery.yml:
Set
dr_server_recovery_keyininventories/prod/host_vars/disaster-recovery.ymlagainSet passwords in
inventories/prod/group_vars/disaster_recovery.ymlagainEncrypt them and run the playbook for recovery:
$ ansible-vault encrypt inventories/prod/group_vars/disaster_recovery.yml
$ ansible-playbook playbooks/disaster-recovery.yml -i inventories/prod/ -e dr_ssh=1 -e dr_recover=1 -K --ask-vault-pass
The roles do not overwrite data in possibly not empty directories. Thus we have to move restored data ourself:
$ incus exec backup -- bash -c "mv /var/lib/barman-restore/gnuhealth-psql /var/lib/barman/gnuhealth-psql"
$ incus exec backup -- bash -c "rmdir /opt/gnuhealthbak/restic-repo && mv /opt/gnuhealthbak/restic-repo-restore /opt/gnuhealthbak/restic-repo"
Regarding the controller we want to use the old configuration but the new SSH keys. So we put those together:
$ rm -r /opt/ansible-restore/gnuhealth-ansible/fetch/*
$ cp -r /opt/ansible/gnuhealth-ansible/fetch/* /opt/ansible-restore/gnuhealth-ansible/fetch/
$ cd /opt/ansible-restore/gnuhealth-ansible
Next we run the
gnuhealth.ymlplaybook to recreate the structure we had. Thepostgresqlrole can not recreate the structure yet without creating a new cluster because it relies on config files being created and asking the running service for paths. Passing the flag gh_restore prevents thegnuhealthrole from running database related tasks. The control boolean backup is set to false because we do not newly set up the backup system but recover it. But we set gh_ssh_key and psql_barman to true to get new SSH keys (by default they overtake the backup boolean or fall back to false).
$ ansible-playbook playbooks/gnuhealth.yml -i inventories/prod -e gh_restore=1 -e backup="" -e gh_ssh_key=1 -e psql_barman=1 -K --ask-vault-pass
Now we can delete the previous temporary cluster and restore from the backup system. We skip the
postgresqlrole because it would restart the service we just stopped and the gnuhealth role just to not wait for its execution time.
$ incus exec postgresql-db -- bash -c "sudo systemctl stop postgresql && sleep 10 && sudo find /opt/gnuhealth/postgresql/15/main/ -mindepth 1 -delete"
$ ansible-playbook playbooks/gnuhealth.yml -i inventories/prod/ -e brm_restore=1 -e rstc_client_restore=1 -e postgresql="" -e application="" -K --ask-vault-pass
Finally make a complete clean run of the playbooks:
$ ansible-playbook playbooks/gnuhealth.yml -i inventories/prod -K --ask-vault-pass
$ ansible-playbook playbooks/desktop.yml -i inventories/prod -K --ask-vault-pass
And verify everything is working fine again!
4.2.2.8. Limitations
The environment of the client and disaster-recovery system will vary between different settings and it is out of the scope of this example to provide instructions how to ensure network connectivity for any given scenario.
For high availability you would want redundancy:
Consider duplicating the
nginx-web,gnuhealth-hisandpostgresql-dbinstances for redundant software.See Incus load balancers, Nginx load balancers and Pgpool-II for failover/load balancing and PostgreSQL high availability for data consitency if you need starting points. Note that attachments are stored on gnuhealth-his and would have to be kept consitent as well.
Consider setting up an Incus cluster for redundant hardware. Make yourself familiar with different Incus storage options.
Regarding the monitoring system it is (Incus host) internal yet and not part of a backup / disaster recovery system yet:
If it should be extended for systems outside the Incus host you would need to add authentication to the communication between the Grafana Alloy agent and Prometheus/Loki, change HTTP to HTTPS thus also provide certificates and ensure network connectivity and firewall rules are in place
If its data is critical - and e.g. has legal value - consider integrating PostgreSQL and the backup / disaster recovery system
You might want an external solution to perform health checks on the monitoring system if you rely on its alerts because a silent outage would be problematic
Apart from the monitoring system not being part of the disaster recovery system you might also want to add your CA to it. Besides the firewall rules are only blocking non-SSH ports but not restricting IP addresses. You might want to restrict it to your Incus host and
adminsystem. But make sure your admin has a static IP address or subnet or in other words be very sure not to lock yourself out. If you have physical access to it you might also prefer to not allow any IP address apart from the ones sending files. The whole recovery process could have less commands and simpler automation if the roles would support overwriting or deleting data. But it was prioritized to not risk undesired data loss.